



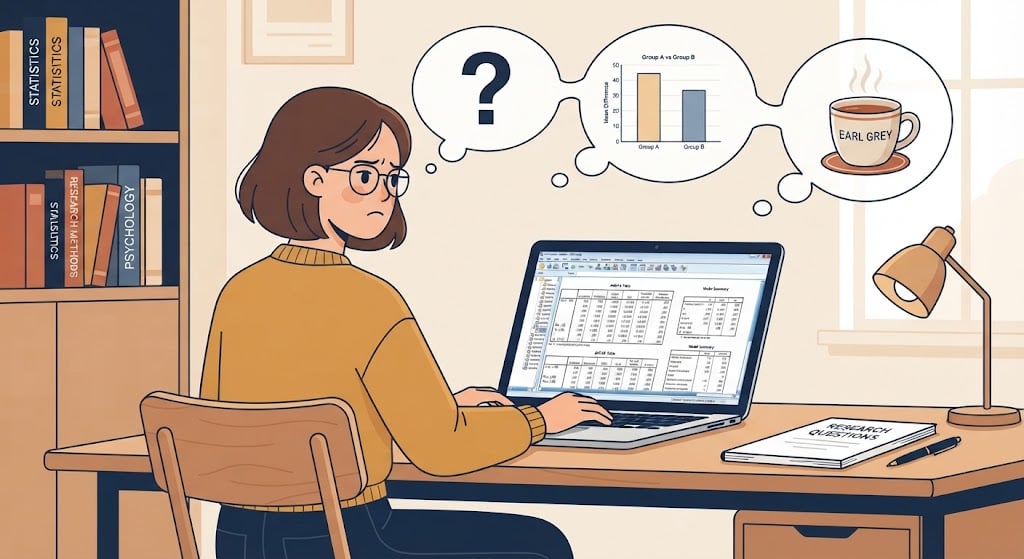
You have your dataset open, your research question written down, and a cup of tea going cold beside you. Then you reach the SPSS menu and freeze. Correlation, t-test, ANOVA, regression: they all sound plausible, and none of them feels certain.
If that sounds familiar, you are in good company. Most students are not stuck because they cannot click the right button. They are stuck because nobody has shown them how to read a question and work out what it is really asking.
Start With the Question, Not the Software
Before you touch SPSS, look closely at the wording of your research question. What are you actually trying to find out?
Picture a psychology student exploring whether hours of sleep are related to concentration scores. That question is about a relationship between two measurements, so correlation becomes a sensible option, provided the data and assumptions fit.
Now tweak it: Do students who sleep fewer than six hours score differently on concentration from those who sleep six or more? The topic is the same, but the question has shifted. You are now comparing two groups, not checking whether two scores move together.
This skill matters most from Year 2 onwards, particularly in psychology, health sciences, business and social sciences. Markers expect you to justify your choice, check assumptions and explain what the result means.
Why Students Get Lost
The most common trap is choosing a test from the dataset instead of the question. Two variables? “Must be correlation.” Three groups? “ANOVA.” Lots of predictors? “Regression.” Sometimes you will be right, but you will have guessed.
Numbers in SPSS can also mislead you. If treatment group is coded 1 and control group is coded 2, those numbers are labels, not measurements.
Study design matters just as much. Imagine a nurse researcher comparing pain scores before and after a treatment. The same patients give both scores, so the observations are linked. Compare that with two separate groups of patients, one treated and one not. The topic is similar, yet the data structure is completely different.
Matching Common Tests to Common Questions
Here is a plain-English way to think about the main options.
Correlation asks whether two variables are associated. Pearson’s is typically used for linear relationships between quantitative variables, while Spearman’s offers a rank-based alternative when that suits the data better.
T-tests compare means. An independent-samples t-test compares two separate groups. A paired-samples t-test is for related measurements, such as blood pressure recorded from the same patients before and after an intervention.
ANOVA compares a continuous outcome across three or more groups. A significant result tells you the means are not all alike, but not which groups differ.
Regression goes further. It examines an outcome in relation to one or more predictors. A researcher might ask whether study hours, attendance and previous grades are associated with an exam mark.
Getting Expert Support Without Losing Your Own Understanding
At some point, many students decide to look for Professional SPSS Assignment Help UK, usually when a deadline is close and the output looks like a foreign language. That is a perfectly reasonable instinct, and the most useful support is the kind that explains its reasoning.
A good explanation shows why a test fits your question, what its limits are and how to describe the findings in your own words. If you come away understanding those three things, you can defend your work in a viva or answer a follow-up question confidently.
The table itself is only evidence. The thinking behind it is what your marker is really reading for.
Questions to Ask Before You Choose
Work out your outcome first, then decide what role everything else plays. These questions help:
- What type of variable is my outcome? A continuous score, a category and a count each lead somewhere different.
- How many groups or predictors are involved? This narrows the options, but never decides them alone.
- Are my observations independent or related? Repeated measures need different thinking from separate groups.
- Do the assumptions make sense for my data? Independence, linearity, normality, equal variances and outliers all matter, depending on the test.
Take a business student asking whether customer satisfaction differs across three service channels. The first job is asking how satisfaction was measured, how the groups were formed and whether the observations are independent.
A Practical Routine That Works
Slow down before you open the Analyze menu. Ten minutes spent defining the question can save hours of interpreting an analysis that was never suitable.
Start by writing the question in one plain sentence with no jargon. If you cannot do that, the question probably needs refining before the test does.
Then sort it into one of four types:
- Are these groups different? Think comparison.
- Are these variables related? Think association.
- Can these variables explain or predict an outcome? Think regression.
- Are these measurements from the same people? Think paired data.
Next, explore your data. Frequencies, descriptive statistics and simple graphs reveal missing values and odd entries before they cause trouble. Only then check the assumptions for your chosen test.
Reading the Output Like a Researcher
When the output appears, resist the urge to paste every table into your report. Pick out what answers your question and explain it in ordinary language.
Instead of writing only “p = .03”, say what you tested, whether there is evidence of a difference or relationship, and what the direction and size of the finding suggest.
Remember too that a p-value is not the whole story. It gives evidence against a null hypothesis under certain conditions. It does not prove your hypothesis, nor does it show that a result matters in practice. Effect sizes and confidence intervals add that context.
Mistakes Worth Avoiding
Copying a classmate’s test. Similar topics can hide very different designs and variable structures.
Treating significance as the finish line. A result can be statistically significant and still tiny.
Reading correlation as causation. If sleep and concentration are linked, that does not prove more sleep causes better focus. Other factors may be involved.
Ignoring paired data. Before-and-after scores from the same people are not the same as scores from two unrelated groups.
Ticking assumption checks mechanically. Following a tutorial click by click is not the same as knowing why a check matters.
Letting SPSS tell the story. Software calculates numbers. It cannot judge whether your question was sensible or whether your design supports your conclusion.
The Takeaway
The hardest part of SPSS is rarely the software. It is the thinking before and after the calculation.
Begin with the question, identify your variables, and work out how they were measured and how the observations relate. Then choose a test whose assumptions are reasonably met and interpret the result in context.
Keep one question close at hand: what does this analysis allow me to say, and what does it not? That keeps the statistics tied to the research instead of turning your assignment into a pile of screenshots. Good work is about the claim your data and design can honestly support.